Model your system visually
Drag sources, queues, and workers onto a canvas and connect them. Each component is configurable: arrival rates, processing time distributions, concurrency limits, failure rates.
Parameterize your model and run what-if scenarios to explore tradeoffs. What you see is what gets simulated. No config files, no code.
Configure processing times that match production
Choose from 9 distribution types including lognormal, exponential, gamma, pareto, bimodal, and custom shapes to match how your services actually behave. Fit distributions to target percentiles like p50 and p99.
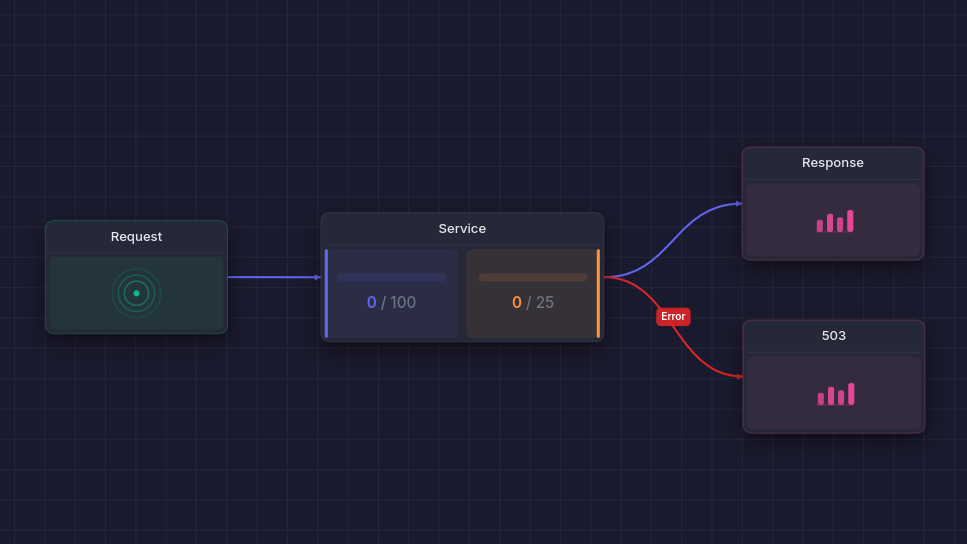
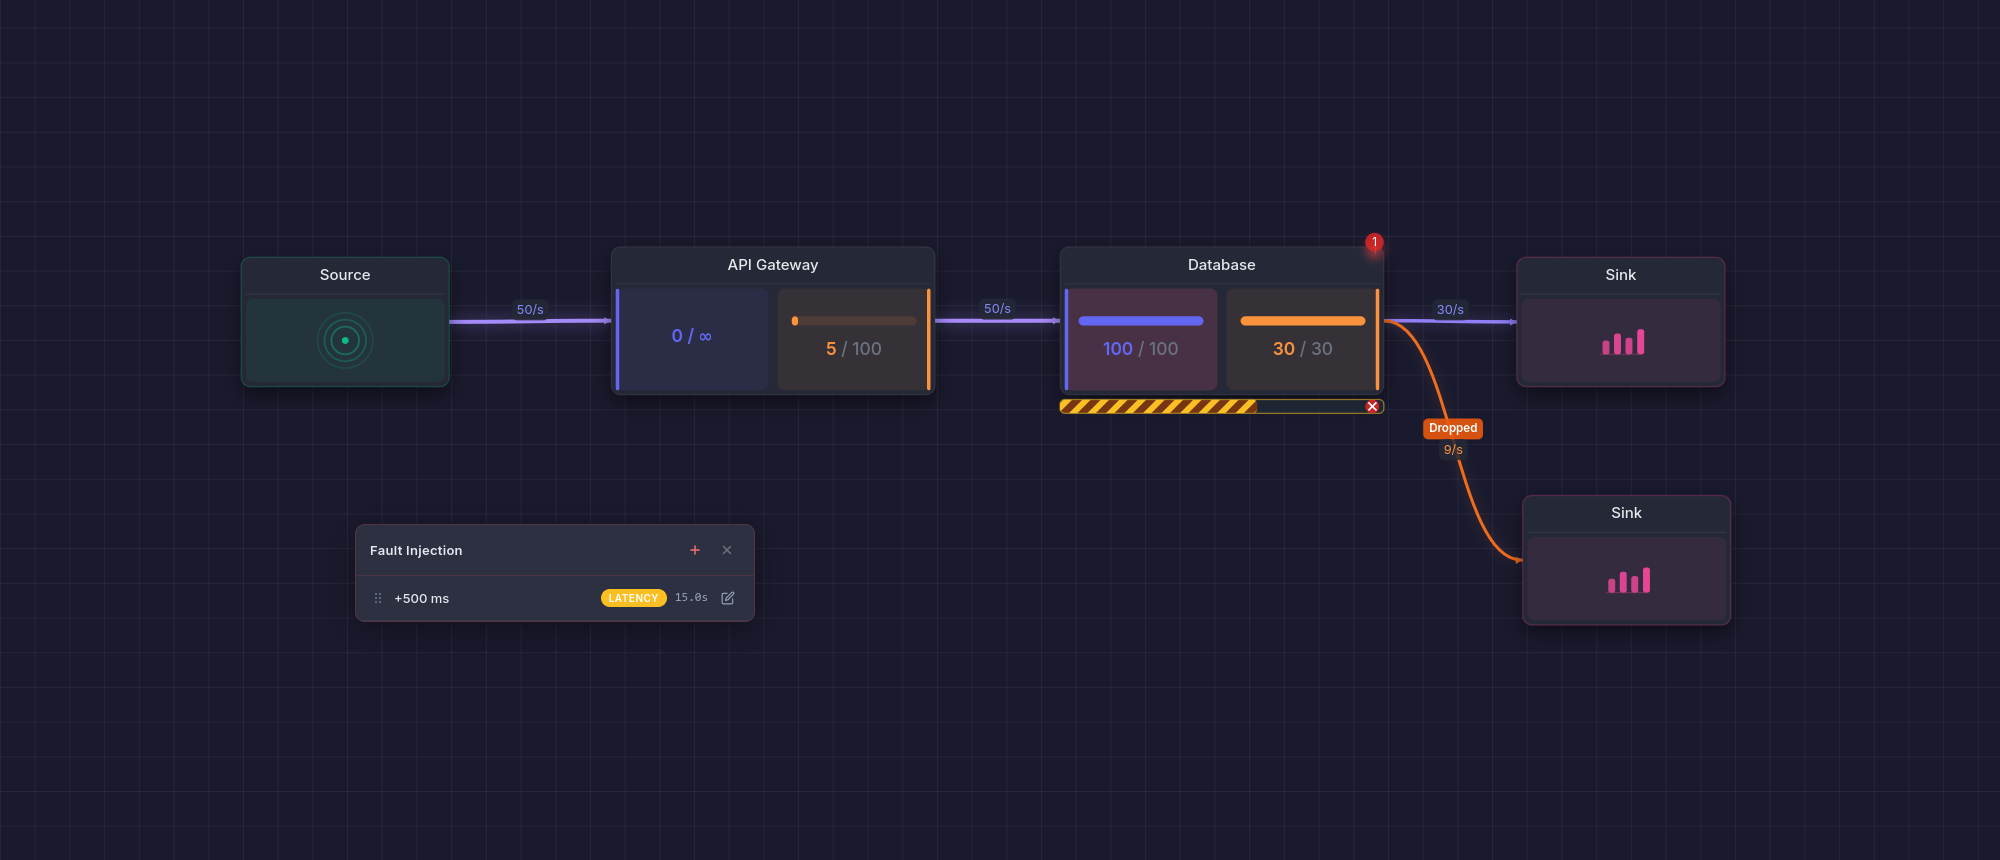
Inject failures and traffic spikes
Simulate complete outages, success rate degradation, latency spikes, capacity reduction, and message bursts. Shape traffic with ramps and staged load profiles. Model availability zones and shared dependencies that can fail together.
See how your system responds before it happens for real.
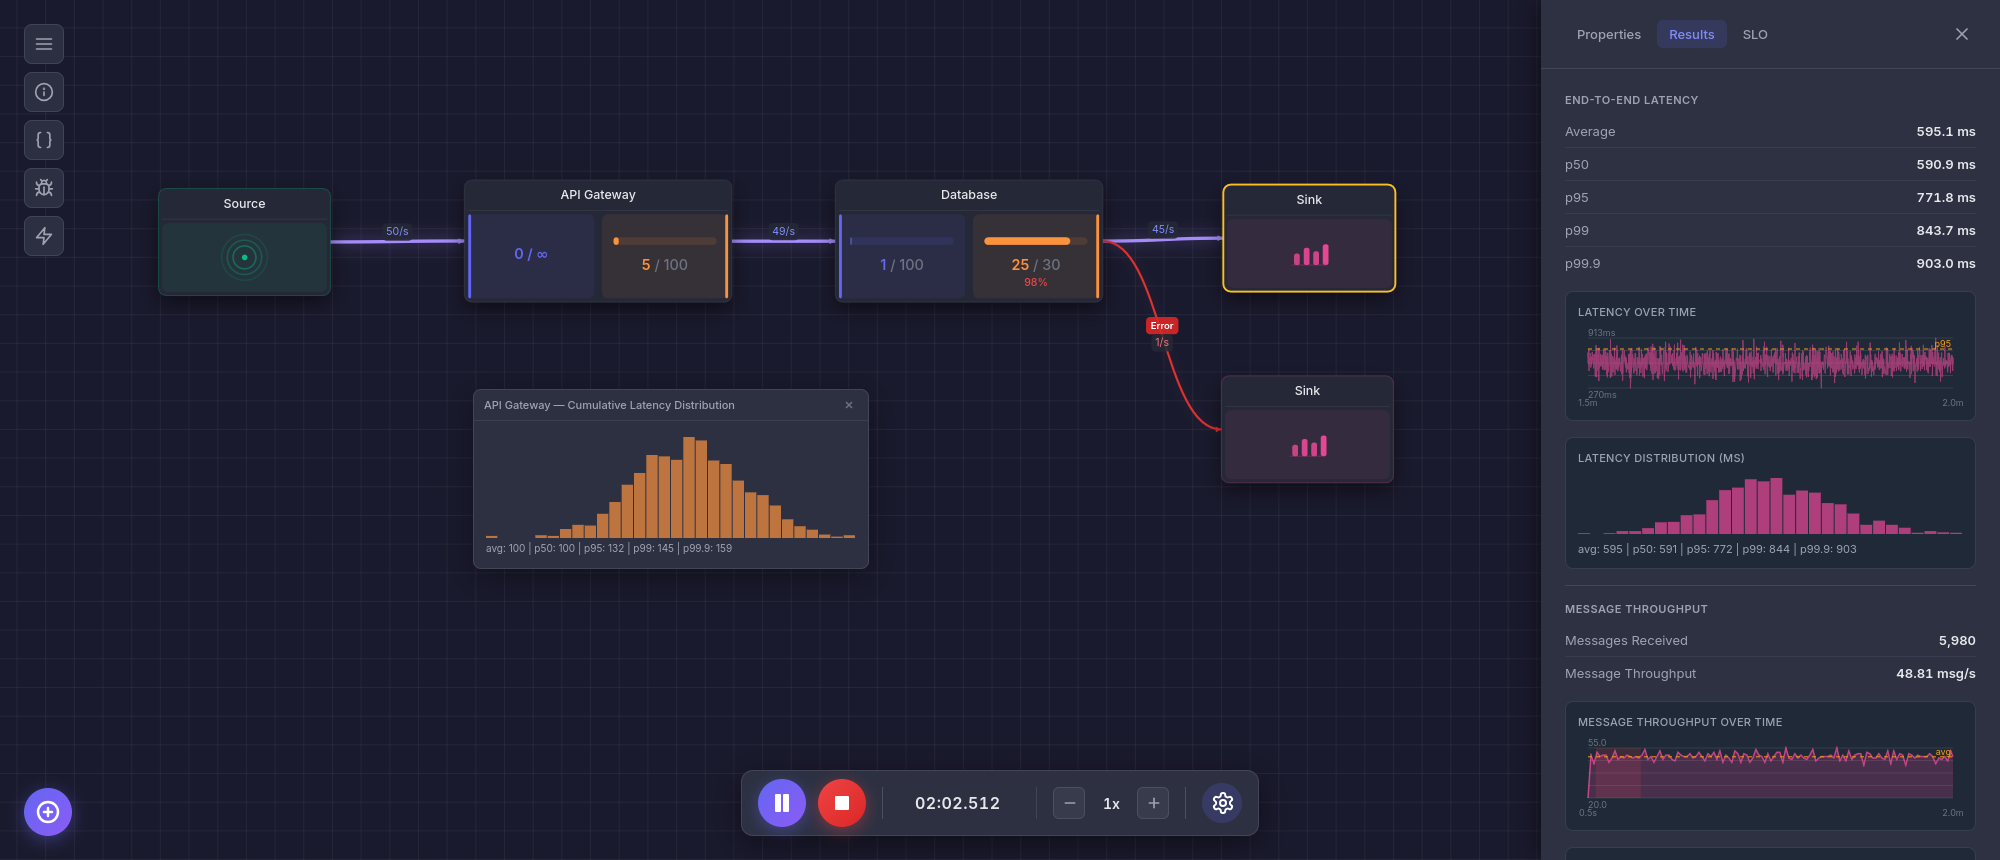
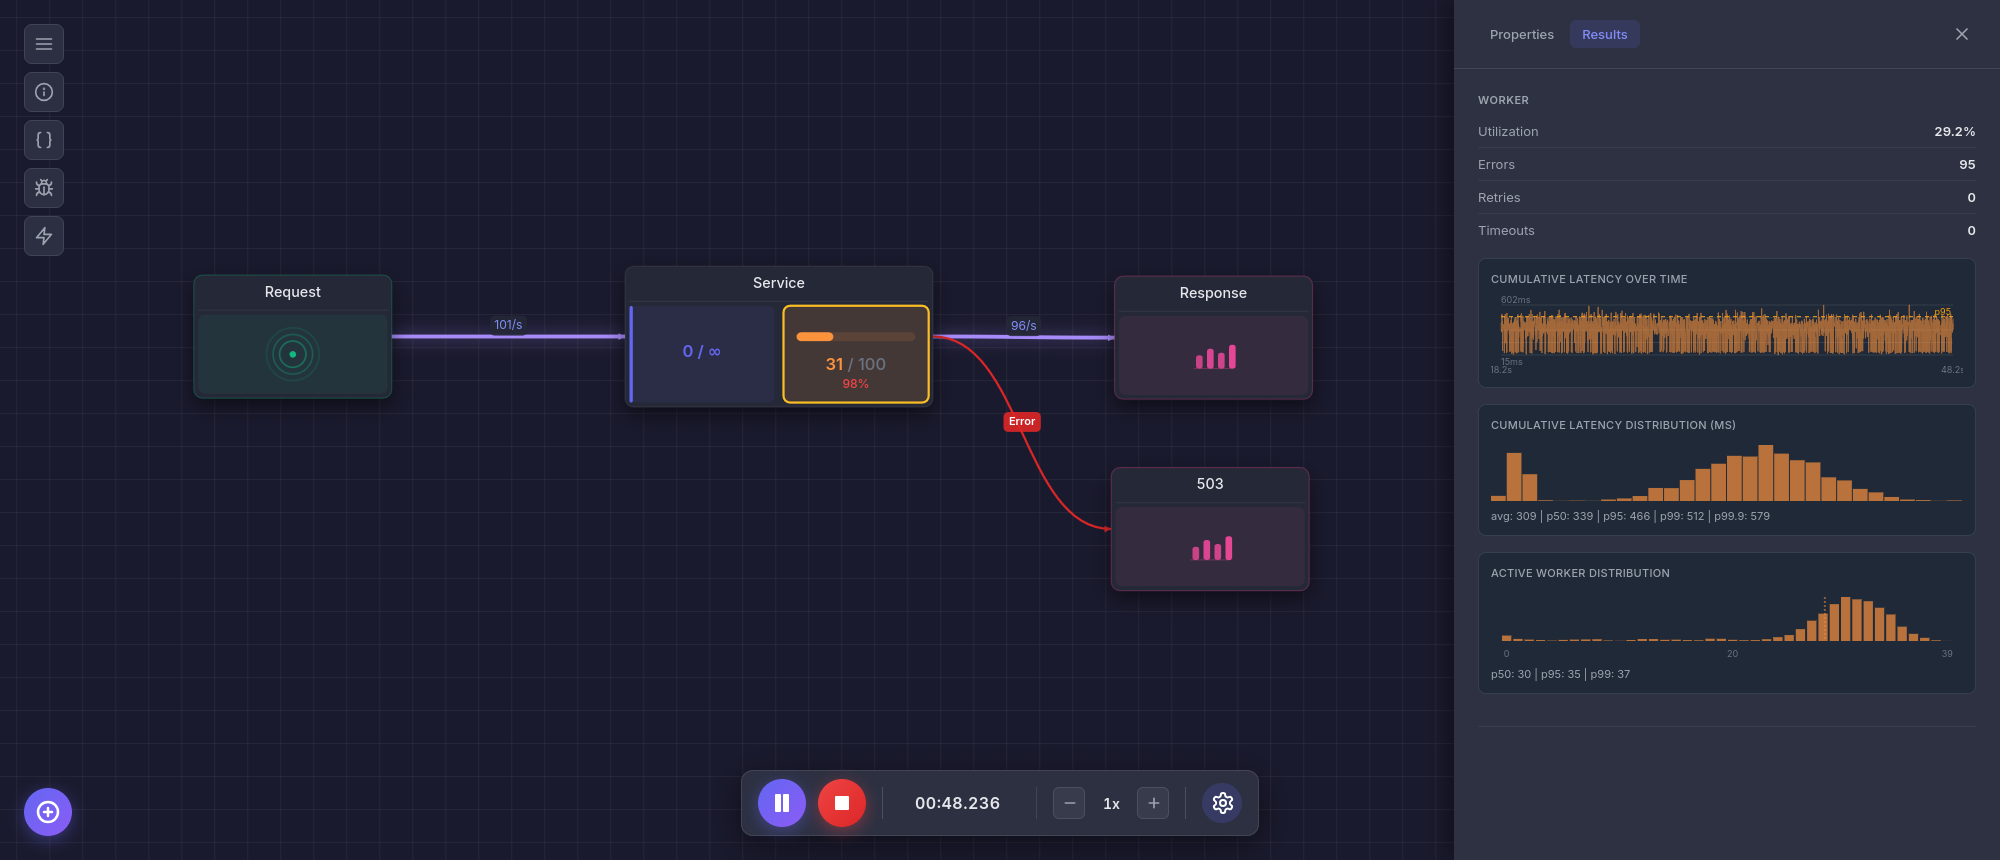
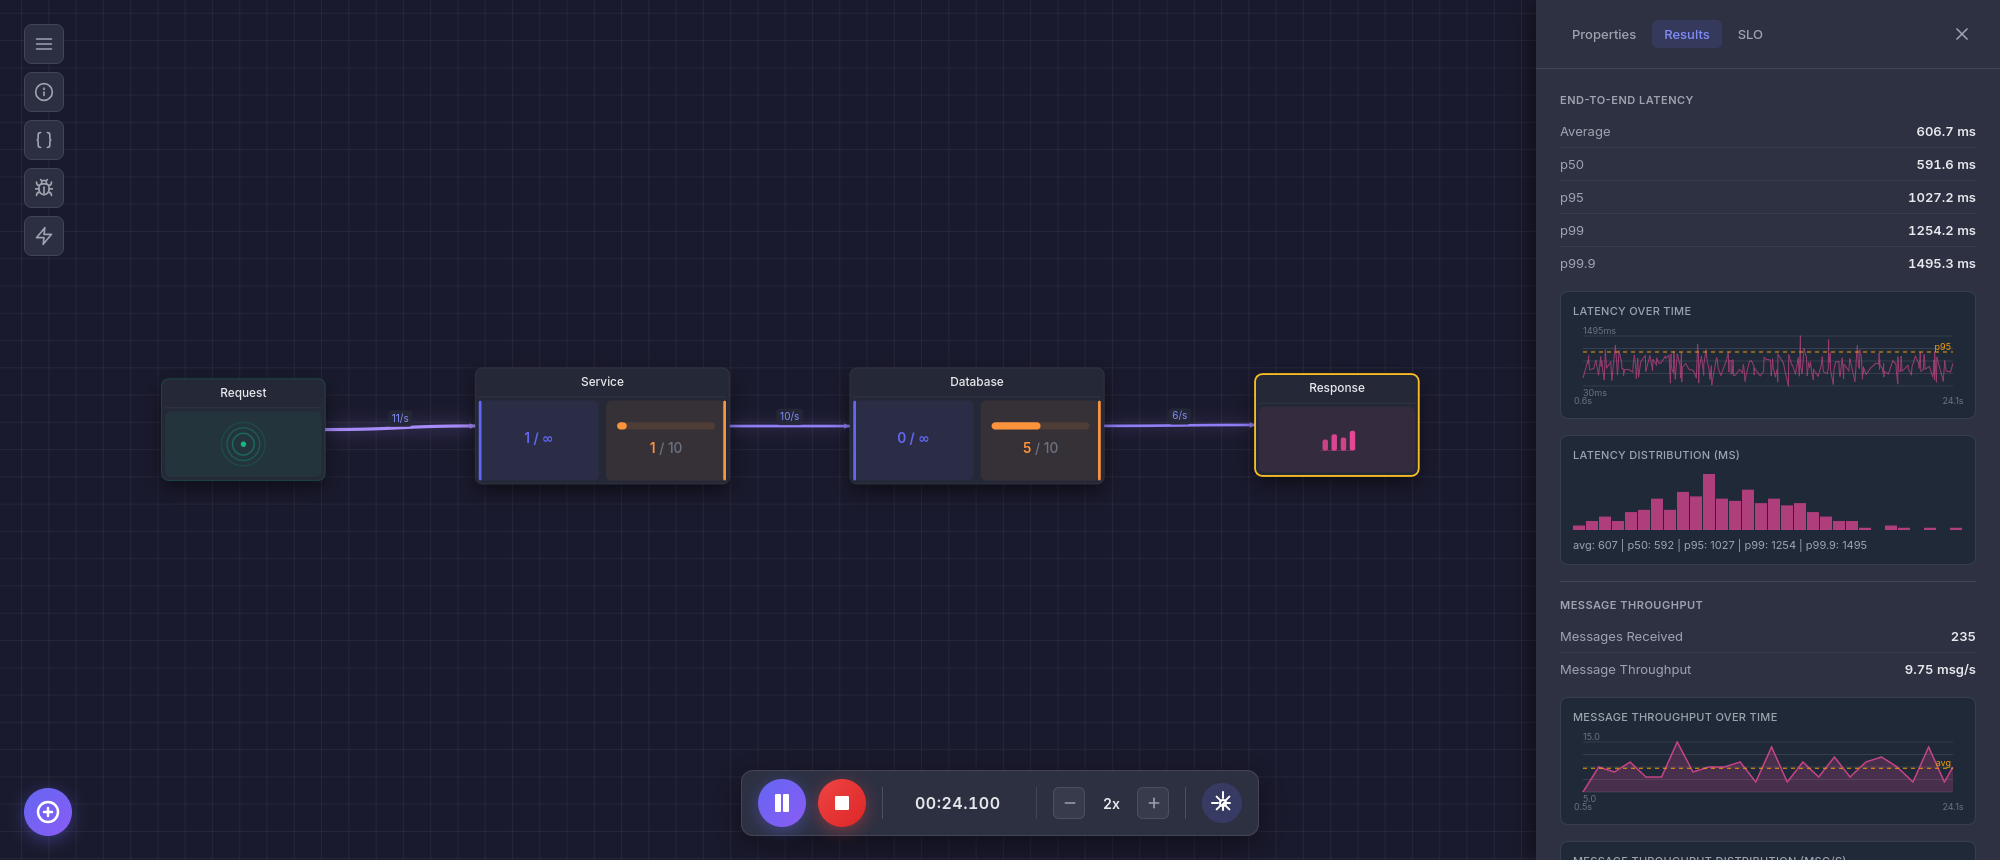
Measure what matters
See latency percentiles, throughput over time, queue depths, and utilization. Set SLO targets and watch whether your system meets them under load.